DBSCAN Clustering in MATLAB
Implement DBSCAN in MATLAB with core, border, and noise points, two clustering parameters, and an example with irregularly shaped clusters.

On this page
DBSCAN groups nearby dense regions while leaving points outside those regions unassigned as noise. It uses a neighborhood radius and a minimum point count rather than a preset number of clusters. Martin Ester, Hans-Peter Kriegel, Jörg Sander, and Xiaowei Xu introduced the method in 1996. For background, see the Wikipedia article on DBSCAN (opens in a new tab).
This MATLAB implementation demonstrates how core points expand clusters and how border points join without expanding them. It can identify irregularly shaped groups separated by low-density regions, but one global density scale may not suit every dataset.
How DBSCAN works
DBSCAN has two parameters: the radius and the minimum number of points MinPts. The -neighborhood of a point is the set of data points within distance of it:
In this code, the neighborhood includes the point itself. Based on its neighborhood, every point has one of three roles:
- A core point has at least
MinPtspoints in its -neighborhood. - A border point is not a core point, but it lies in the neighborhood of a core point.
- A noise point is neither of these.
The algorithm visits the points one by one. When it finds an unvisited core point, it starts a new cluster and adds all its neighbors. Each neighbor that is also a core point adds its own neighbors to the list, so the cluster grows until no new points can be reached. Border points join the cluster but do not expand it. The points that no cluster reaches remain noise.
Choosing the parameters
The result depends mainly on and MinPts. A small splits clusters and marks many points as noise. A large merges clusters that should be separate. A common rule of thumb is to set MinPts to at least the number of dimensions plus one, often about twice the number of dimensions. Then can be read from a plot of the sorted distances of each point to its MinPts-th nearest neighbor: a good value is near the point where the curve bends sharply upward.
How to run it
Run main.m in MATLAB. It loads the sample data from mydata.mat, runs DBSCAN with the values in the script, and plots the result with PlotClusterinResult.m:
epsilon=0.5;
MinPts=10;
IDX=DBSCAN(X,epsilon,MinPts);
The function [IDX, isnoise] = DBSCAN(X, epsilon, MinPts) in DBSCAN.m takes a data matrix X with one sample per row. It returns the cluster index of every point in IDX, where 0 means noise, and the logical vector isnoise. To cluster your own data, load your matrix into X and adjust epsilon and MinPts.
The function computes the full distance matrix with pdist2, so it probably needs the Statistics and Machine Learning Toolbox. The full distance matrix requires memory proportional to the square of the number of points, so estimate its size before using a large dataset. MATLAB R2019a and later versions also include a built-in dbscan function in the Statistics and Machine Learning Toolbox.
Example result
The figure below shows a sample result. DBSCAN finds the two clusters, a round one and a crescent shaped one around it, and also marks the noisy points. The algorithm parameters are shown above the figure.
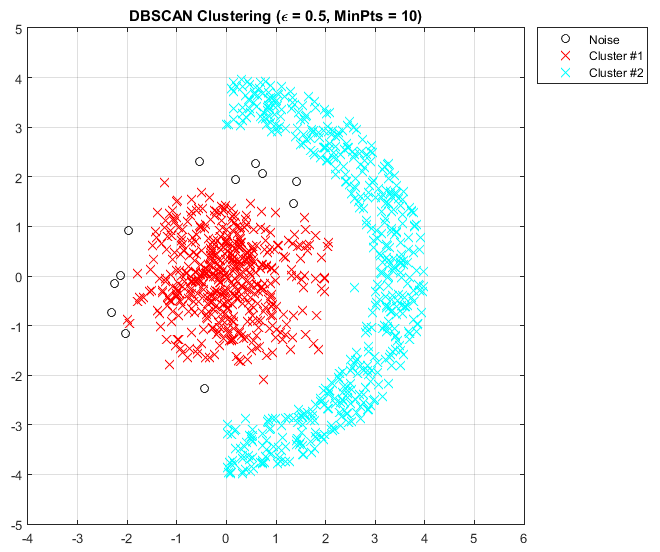
Sample result of the MATLAB implementation of DBSCAN clustering
Check the result
Inspect how the labels change when varying epsilon and MinPts, and review feature scaling before interpreting distances. A point labeled noise is not automatically an error or a real-world anomaly. Nearby clusters of different densities may not be separated well by one radius. The example includes each point in its own neighborhood, so use the same counting convention when comparing implementations.
Applications
DBSCAN is used where clusters have irregular shapes or where the data contains outliers, for example in the analysis of spatial and geographic data, anomaly detection and image segmentation.
Related posts
- Evolutionary Data Clustering in MATLAB, clustering and automatic clustering with GA, PSO and DE.
- Neural Gas and GNG Networks in MATLAB, for clustering and topology learning.
Downloads
How to cite
If you use this code or tutorial in your work, articles or publications, please cite it.
Mostapha Kalami Heris, DBSCAN Clustering in MATLAB (YPML110), Yarpiz, 2015. https://yarpiz.com/dbscan-clustering-ypml110@misc{yarpiz-ypml110,
author = {{Mostapha Kalami Heris}},
title = {{DBSCAN Clustering in MATLAB}},
howpublished = {Yarpiz},
year = {2015},
note = {Code YPML110},
url = {https://yarpiz.com/dbscan-clustering-ypml110}
}Published Updated
Comments