Intelligent Image Color Reduction and Quantization
Reduce image colors in MATLAB with k-Means, fuzzy c-Means, or a self-organizing map, using RGB or weighted HSV values and a smaller palette.

On this page
This post shares a MATLAB implementation of color quantization and color reduction for images. It uses three clustering approaches:
- -Means algorithm
- Fuzzy -Means clustering (FCM)
- Self-Organizing Map (SOM) neural network
The code can cluster the colors in either RGB or HSV coding, and you choose which one to use.
The problem
A true color image can contain many thousands of different colors. Color quantization replaces them with a small palette of colors, chosen so that the new image looks as close as possible to the original. A palette representation can reduce storage, depending on the file format and encoding. Color reduction is also useful for displays with limited palettes and for image segmentation.
Color quantization is a clustering problem. Every pixel is one data point with three features, its color values, for example . The pixel positions are not used. A clustering algorithm groups these points into clusters, the cluster centers become the palette, and each pixel is replaced by the center of its cluster. A standard hard-clustering objective, used by k-Means, chooses centers to keep squared color error small:
where is the color of pixel . FCM and SOM use different learning objectives, so this formula should not be read as the exact optimization performed by all three methods.
The three clustering methods
- -Means assigns each point to the nearest center and moves each center to the mean of its points, until the assignment stops changing. The standard algorithm is due to Stuart Lloyd (1957), and the name -Means was introduced by James MacQueen in 1967. The code uses the MATLAB function
kmeanswith up to 1000 iterations. - Fuzzy -Means (FCM), introduced by Dunn in 1973 and developed by Bezdek in 1981, gives every point a membership degree between 0 and 1 in each cluster. The code uses the MATLAB function
fcmand assigns each pixel to the cluster with its largest membership. - Self-Organizing Map (SOM), proposed by Teuvo Kohonen in 1982, is a neural network whose neurons lie on a grid. The weights of the neurons become the palette. The code builds the map with
selforgmapinSOM.mand trains it on a random 10 percent of the pixels, which saves time on large images. The grid has neurons, so the final number of colors can differ slightly from the requested one (for example, 10 colors give a grid with 12 colors).
RGB or HSV
In RGB coding, each pixel is clustered by its red, green and blue values. In HSV coding, the code first converts the colors to hue, saturation and value with rgb2hsv. It then multiplies the three components by the weights 3, 1 and 2, so that differences in hue count the most and differences in saturation the least. After clustering, the weights are removed and the palette is converted back to RGB with hsv2rgb.
How to run it
Run main.m in MATLAB. The script asks for its inputs in a few dialogs:
- Choose an image file (JPG or PNG).
- Choose the color coding, RGB or HSV.
- Enter the number of colors (the default is 25).
- Choose the clustering method: -Means, FCM or SOM.
The script then shows the original image and the color reduced image side by side. The download includes two sample photos, tabriz-el-golu.jpg and tabriz-maghbara.jpg.
The code calls functions from several MATLAB toolboxes: kmeans probably needs the Statistics and Machine Learning Toolbox, fcm the Fuzzy Logic Toolbox, and selforgmap the Deep Learning Toolbox. You need only the toolbox of the method you choose, plus the image functions im2double and imshow.
The picture below shows the output for a sample image, reduced to 64 colors with the SOM network.
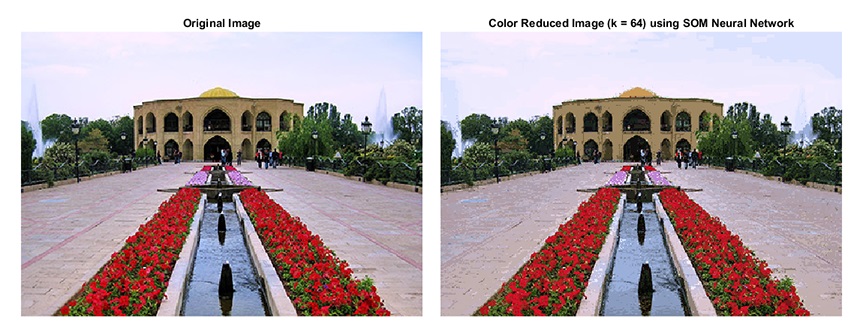
Result of clustering-based color reduction applied to a picture of El-Gölü (opens in a new tab) (Tabriz)
Check the result
Compare the actual palette size, visual error, and encoded file size rather than assuming fewer colors always produce a smaller file. The SOM grid can contain more colors than requested, and random pixel sampling can change results between runs. The HSV option treats hue as a linear coordinate even though hue wraps around, so reds near 0 and 1 can appear artificially far apart. Inspect those boundary colors and preserve useful edges and gradients when choosing the method.
Related posts
- Evolutionary Data Clustering in MATLAB, clustering with GA, PSO and DE.
- DBSCAN Clustering in MATLAB, a density based clustering method.
- Neural Gas and GNG Networks in MATLAB, competitive networks related to the SOM.
Downloads
How to cite
If you use this code or tutorial in your work, articles or publications, please cite it.
Mostapha Kalami Heris, Intelligent Image Color Reduction and Quantization (YPAP117), Yarpiz, 2015. https://yarpiz.com/color-reduction-and-quantization-ypap117@misc{yarpiz-ypap117,
author = {{Mostapha Kalami Heris}},
title = {{Intelligent Image Color Reduction and Quantization}},
howpublished = {Yarpiz},
year = {2015},
note = {Code YPAP117},
url = {https://yarpiz.com/color-reduction-and-quantization-ypap117}
}Published Updated
Comments